
I. INTRODUCTION
The fiber network of most network operators generally comprises a heterogeneous mixture of fibers and cables, produced by different vendors over many different years. Thus, there can be a correspondingly important variation in the physical properties of deployed fibers. Along with fiber attenuation and chromatic dispersion, polarization mode dispersion (PMD) is an important parameter, as it can limit data rates and transparency length.
During the last years Deutsche Telekom has reviewed its network [1] and characterized the PMD value of a large number of fibers. Fiber links exhibiting excessively high PMD values for transmission of 40 Gbit/s and beyond were identified. A single high-PMD section can be sufficient to render an entire 400 km link unusable for high-speed transmission. In order to avoid such data rate and transmission length limitations, PMD compensators can be used for each channel [2], an approach that can become quite costly and unwieldy. Alternatively, or in addition, advanced modulation schemes (e.g., 40G RZDQPSK) can be applied to partially mitigate the sensitivity to PMD [3]. The third possibility to reduce the influence of link PMD is to identify and replace the “bad” fiber sections [4]. Whereas a replacement of all fiber sections along an entire link is extremely costly and time consuming. Fortunately, it is generally the case that the square of the accumulated PMD along a fiber link does not grow linearly as a function of distance, but rather that this growth tends to be localized in one or just a few distinct portions or sections accounting for the large majority of the total link PMD. As a result, an identification and selective replacement of those few distinct portions, enabled by the availability of a suitable measurement technique is much more cost effective and could be economically competitive to the deployment of PMD-tolerant transmission systems.
In this paper, a prototype tunable random-scrambling polarization optical time-domain reflectometer (RSPOTDR) [5] was used in a field trial to identify and exchange fiber sections along buried cables having high PMD in the network of the fixed network division of the Deutsche Telekom group (T-Home). In order to compare the obtained results and demonstrate the successful improvement, the cumulative PMD along the fibers was characterized before and after replacement.
II. MEASUREMENT PRINCIPLE AND PROCEDURE
A classical OTDR measures the attenuation along an optical fiber by emitting short optical pulses and performing time-gated detection of the Rayleigh backscattered light (or reflection from localized Fresnel reflections) of each pulse as a function of time delay (optical distance) along the fiber. In this way, localized information on the fiber attenuation, splice and connector quality can be obtained. It has long been “standard procedure” to use an OTDR to locate and characterize fiber sections showing excessive loss and/or connectors exhibiting high reflection, and, if necessary, repair or replace them in order to ensure that the transmitted signals correspond to predetermined physical limits.
However, as mentioned above, ensuring low attenuation is not sufficient for links carrying high data rates over long-haul distances, since the signal quality is also very much limited by the link PMD. Although overall (“endto-end”) PMD can be characterized for a link with one of a number of different established measurement techniques, up to now, there has not been a proven reliable means to locate and quantify “bad PMD” sections in a field-installed link.
Using the prototype RS-POTDR instrument, a cumulative PMD curve can be obtained as a function of fiber length and high-PMD fiber portions thereby identified [5]. The wavelength of the laser will be tuned and for each wavelength the input state of polarization (SOP) is randomly scrambled. A screenshot of a typical measured cumulative PMD curve for a test fiber is shown in Fig. 1. A traditional OTDR trace corresponding to the backs cattered power is overlaid on the same distance scale. The fiber portions contributing most significantly to the cumulative PMD can be identified. The detailed optical setup of the RS-POTDR prototype used for this work is described in [4].
III. RESULTS OF MEASUREMENT OF FIBERS WITH IINCREASED PMD
A first trial to test the measurement principle under field conditions was performed in the network of Deutsche Telekom [4]. Fibers were analyzed and portions having high PMD values could be identified. The main goal of this field test was to identify the bad fiber sections of a fiber link in a cable, to repair the cable and to verify the results by repeating the measurements after the repair.
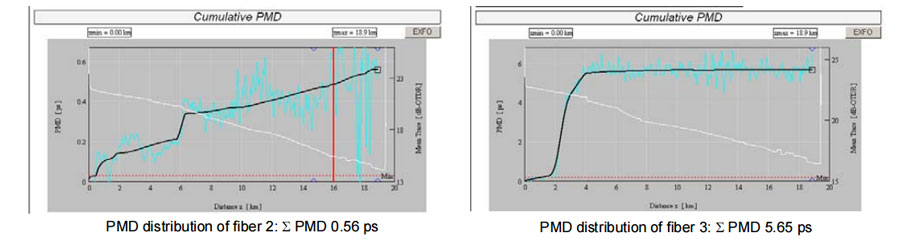
We used a cable in which one fiber exhibited a high PMD value. This fiber was the “fiber under test” (FUT) which had to be repaired. Another fiber having a low PMD value served as a “donor” fiber to be grafted into and replace that section of the FUT which significantly contributed to the PMD. Fiber#3 with an overall PMD value of 5.65 ps was the FUT requiring repair and fiber#2 with an overall PMD value of 0.56 ps served as the donor fiber. In Fig. 1 the local PMD-distribution for both fibers before replacement is shown. As a check, we repeated the measurements from the opposite end and confirmed an accurate concordance of both the overall PMD and the corresponding local distribution. Additionally the overall PMD values of both fibers were characterized using the interferometric method (TINTY), i.e. without local resolution. These independently obtained overall-PMD values were in good agreement with those from the RSPOTDR, within a maximum deviation of 10 %.
IV. MEASUREMENT RESULTS AFTER FIBER EXCHANGE
It is anticipated that the most likely approach to improve the PMD behavior of the fiber infrastructure will involve actually replacing the entire “bad” cable portion contributing preponderantly to the cumulative PMD. Unfortunately we had no opportunity to do this in our field trial, and it is for this reason that we used the “donor fiber”. As seen in Fig. 2 the section between 2.0 km and 4.0 km of fiber#3 must be replaced. In this fiber portion fiber#3 has a PMD value of approximately 5.4 ps. Fortunately, fiber#2 exhibits a low contribution to the cumulative PMD value in this section. Thus fiber#2 is an ideal donor fiber for fiber#3 in order to decrease its overall PMD value and
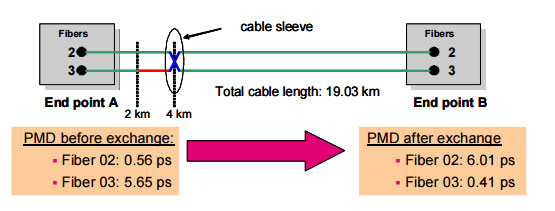
to verify the measurement principle. The topology of the replacement is shown in Fig. 2. The measured PMD curves were correlated with the map of the fiber junction boxes, thus permitting the identification of the appropriate junction boxes to be opened for the cable exchange. We opened one fiber junction box located approximately at km 4 and replaced the first 4 km of fiber#3 by fiber#2 and vice versa. In this way, we anticipated a significant decline of PMD of fiber #3 and additionally that the newly-modified fiber#2 would now exhibit a “bad” fiber section, corresponding to that formerly of fiber#3.
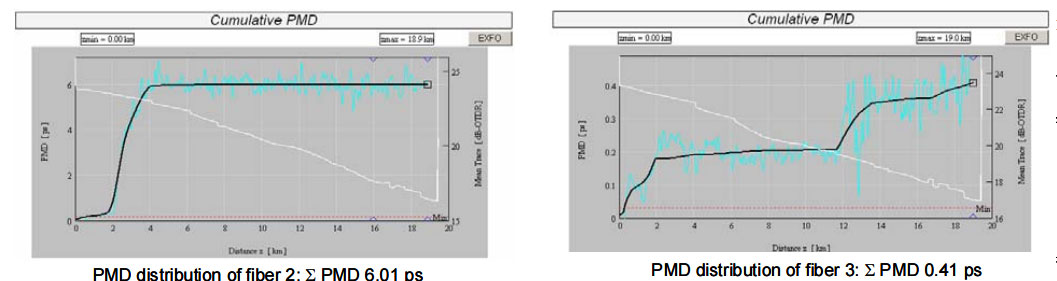
In Fig. 3 the cumulative PMD along the fibers was characterized after interchange of the first 4 km in both fibers. The PMD value of fiber#3 decreased to 0.41 ps (versus 5.65 ps before) and fiber#2 had a PMD value of 6.01 ps (versus 0.56 ps before). Thus fiber#3 which previously was not suitable for high-speed data transmission was now improved by substitution of the short portion of fiber. Additionally the 4-km high-PMD section moved to fiber#2, thereby clearly demonstrating the underlying field suitability of the measurement principle.
V. INVESTIGATION OF THE PMD-DISRIBUTION OF DIFFERENT FIBERS IN THE SAME CABLE
In the previously described field experiment the basic suitability of the measurement principle for field deployment was tested. The next step was to investigate the PMD distribution of all free fibers with increased accumulated PMD in a common buried cable to make these fibers suitable for high speed transmission systems. The economically best way for that [6] is to replace simultaneously the sections with increased PMD values for all fibers to be improved. Therefore these fibers had to be measured and the obtained results with the PMD distribution of all fibers had to be analyzed and compared to each other.
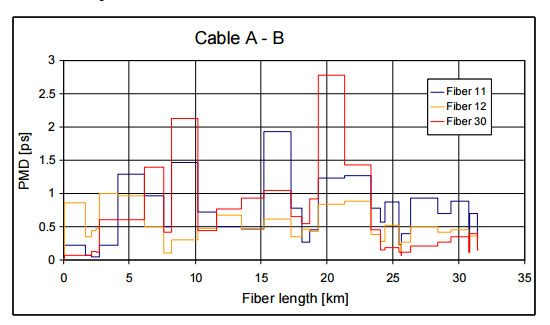
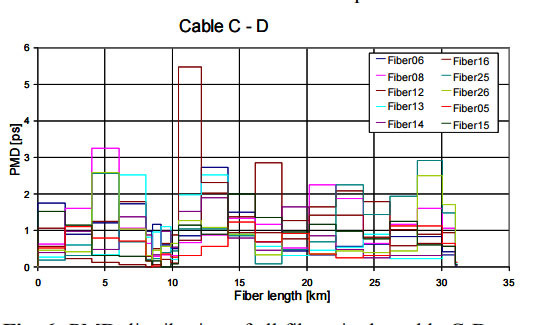
Two different cables with a number of free fibers with lengths of 31.5 km (cable A-B) and 31.08 km (cable C-D) respectively were measured and the PMD distribution of these fibers was recorded. Additionally the splice maps with the location of the sleeves were added to the measured PMD curves. In Fig. 4 the PMD distribution of the investigated fibers in the cable A-B is depicted. In a bar chart the local PMD values of the different sections which are divided by the sleeves are shown as a function of the fiber length in the cable.
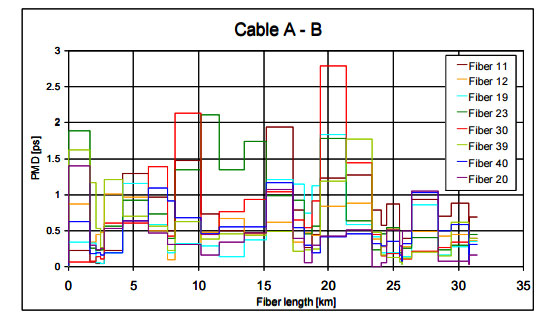
As a result of comparison of the different fibers it can be seen that the PMD along the fiber length is not uniformly distributed and that the sections with the main PMD contribution for the different fibers are in different sections. If we consider only a reduced number of measured fibers in this cable we can conclude that the PMD distribution of these smaller number of fibers can be relatively homogenous (fiber 12) and that sections mainly contributing to the total PMD value can be identified (fibers 11 and 30) as shown in Fig. 5. Furthermore the comparison of the fiber 11 and fiber 30 shows that the mainly contributing sections for these two fibers are unfortunately not located in the same section of PMD value of at least two fibers the replacement for fiber 11 must be done in one section of the cable and the replacement for fiber 30 must be done in another piece of the same cable. Despite of the replacement of only a short cable piece for each fiber to be improved probably a larger number of cable sections in total must be touched for the improvement of both fibers.
A similar behavior concerning the PMD distribution of different fibers in cable C-D is shown in Fig. 6. The PMD of some fibers exhibiting elevated PMD values is concentrated in one or a few short cable sections. In order to find an economically suitable approach to decrease the total PMD value it is necessary to characterize all PMD distribution. All the free fibers in the cable should be carefully analyzed − not just those fibers having comparatively low PMD values. In this way, for each problematic cable section, one can usually identify one or more fiber pairs within that section that are suitable for high speed transmission systems, thereby avoiding physical replacement of that cable section.. However, even if this is not practical, replacement of only those short cable pieces responsible for the majority of the PMD can be economically reasonable instead of the replacement of the whole cable.
VI. CONCLUSION
In a field trial, the PMD distribution in deployed fiber sections was investigated using a novel POTDR prototype instrument, this instrument enabling the single sided measurement of the cumulative PMD of optical fibers. The presented results show the individual PMD of different fiber sections. Hence, sections with very high PMD can be identified with sufficient spatial resolution, and can be subsequently replaced. The measurement technique can not only be applied to old fibers in order to replace bad pieces selectively, but can be also applied for newly installed cables directly after installation to check the quality and the adherence of the fibers to predetermined physical limits. This information is important for network operators who want to improve their networks in order to install systems at 40 Gbit/s and beyond. The measurement technique was applied to investigate the PMD distribution of free fibers in buried cables. The comparison of the obtained PMD curves has shown that the main contribution to PMD for any given fibers in a cable is often found in a different cable segment than that of another fiber in the cable.
Despite of the replacement of only one short cable piece for each fiber to be improved a larger number of cable sections must be touched for the improvement of more than one fiber in the cable. But nevertheless the partial replacement of short cable pieces for different fibers on different places can be economically reasonable instead of the replacement of the whole cable.