
This article is for beginners to learn basic concept appeared in fiber specifications
Only those characteristics of the fibre providing a minimum essential design framework for fibre manufacture are recommended in this clause. Ranges or limits on values are presented in the tables of clause 7. Of these, cable manufacture or installation may significantly affect the cabled fibre cut-off wavelength and PMD. Otherwise, the recommended characteristics will apply equally to individual fibres, fibres incorporated into a cable wound on a drum, and fibres in an installed cable.
Mode field diameter
Both a nominal value and tolerance about that nominal value shall be specified at 1310 nm. The nominal value that is specified shall be within the range found in clause 7. The specified tolerance shall not exceed the value in clause 7. The deviation from nominal shall not exceed the specified tolerance.
Cladding diameter
The recommended nominal value of the cladding diameter is 125 μm. A tolerance is also specified and shall not exceed the value in clause 7. The cladding deviation from nominal shall not exceed the specified tolerance.
Core concentricity error
The core concentricity error shall not exceed the value specified in clause 7.
Non-circularity
1 Mode field non-circularity
In practice, the mode field non-circularity of fibres having nominally circular mode fields is found to be sufficiently low that propagation and jointing are not affected. It is, therefore, not considered necessary to recommend a particular value for the mode field non-circularity. It is not normally necessary to measure the mode field non-circularity for acceptance purposes.
2 Cladding non-circularity
The cladding non-circularity shall not exceed the value found in clause 7.
Cut-off wavelength
Two useful types of cut-off wavelength can be distinguished:
a) cable cut-off wavelength λcc;
b) fibre cut-off wavelength λc.
NOTE – For some specific submarine cable applications, other cable cut-off wavelength values may be required.
The correlation of the measured values of λc and λcc depends on the specific fibre and cable design and the test conditions. While in general λcc < λc, a general quantitative relationship cannot be easily established. The importance of ensuring single-mode transmission in the minimum cable length between joints at the minimum operating wavelength is paramount. This may be performed by recommending the maximum cable cut-off wavelength λcc of a cabled single-mode fibre to be 1260 nm or for worst case length and bends, by recommending a maximum fibre cut-off wavelength to be 1250 nm.
The cable cut-off wavelength, λcc, shall be less than the maximum specified in clause 7.
Macrobending loss
Macrobending loss varies with wavelength, bend radius and number of turns about a mandrel with a specified radius. Macrobending loss shall not exceed the maximum given in clause 7 for the specified wavelength(s), bend radius and number of turns.
NOTE 1 – A qualification test may be sufficient to ensure that this requirement is being met.
NOTE 2 – The recommended number of turns corresponds to the approximate number of turns deployed in all splice cases of a typical repeater span. The recommended radius is equivalent to the minimum bend-radius widely accepted for long-term deployment of fibres in practical systems installations to avoid static-fatigue failure.
NOTE 3 – If, for practical reasons, fewer than the recommended number of turns are chosen to be implemented, it is suggested that not less than 40 turns, and that a proportionately smaller loss increase be required.
NOTE 4 – The macrobending loss recommendation relates to the deployment of fibres in practical single-mode fibre installations. The influence of the stranding-related bending radii of cabled single-mode fibres on the loss performance is included in the loss specification of the cabled fibre.
NOTE 5 – In the event that routine tests are required, a smaller diameter loop with one or several turns can be used instead of the recommended test, for accuracy and measurement ease. In this case, the loop diameter, number of turns and the maximum permissible bend loss for the several-turn test should be chosen so as to correlate with the recommended test and allowed loss.
Material properties of the fibre
1 Fibre materials
The substances of which the fibres are made should be indicated.
NOTE – Care may be needed in fusion splicing fibres of different substances. Provisional results indicate that adequate splice loss and strength can be achieved when splicing different high-silica fibres.
2 Protective materials
The physical and chemical properties of the material used for the fibre primary coating and the best way of removing it (if necessary) should be indicated. In the case of single-jacketed fibre, similar indications shall be given.
3 Proofstress level
The specified proofstress σp shall not be less than the minimum specified in clause 7.
NOTE – The definitions of the mechanical parameters are contained in clauses 3.2 and 5.6 of [ITU-T G.650.1].
Refractive index profile
The refractive index profile of the fibre does not generally need to be known.
Longitudinal uniformity of chromatic dispersion Under study.
NOTE – At a particular wavelength, the local absolute value of the chromatic dispersion coefficient can vary away from the value measured on a long length. If the value decreases to a small value at a wavelength that is close to an operating wavelength in a wavelength division multiplexing (WDM) system, four-wave mixing can induce the propagation of power at other wavelengths including, but not limited to, other operating wavelengths. The magnitude of the four-wave mixing power is a function of the absolute value of the chromatic dispersion coefficient, the chromatic dispersion slope, the operating wavelengths, the optical power, and the distance over which four-wave mixing occurs.
For dense wavelength division multiplexing (DWDM) operations in the 1550 nm region, the chromatic dispersion of ITU-T G.652 fibres is large enough to avoid four-wave mixing. Chromatic dispersion uniformity is, therefore, not a functional issue.
Chromatic dispersion coefficient
The measured group delay or chromatic dispersion coefficient versus wavelength shall be fitted by the three-term Sellmeier equation as defined in Annex A of [ITU-T G.650.1] (see clause 5.5 of [ITU-T G.650.1] for guidance on the interpolation of dispersion values to unmeasured wavelengths).
The Sellmeier equation can be used to fit the data in each range (1310 nm and 1550 nm) separately in two fits, or as one common fit, with data from both ranges.
The Sellmeier fit in the 1310 nm region may not be sufficiently accurate when extrapolated to the 1550 nm region. Because the chromatic dispersion in the latter region is large, the reduced accuracy may be acceptable; if not, it can be improved by including data from the 1550 nm region when performing the common fit, or by using a separate fit for the 1550 nm region. It should be noted that a common fit may reduce the accuracy in the 1310 nm region.
The chromatic dispersion coefficient, D, is specified by putting limits on the parameters of a chromatic dispersion curve that is a function of wavelength in the 1310 nm region. The chromatic dispersion coefficient limit for any wavelength, λ, is calculated with the minimum zero-dispersion wavelength, λ0min, the maximum zero-dispersion avelength, λ0max, and the maximum zero-dispersion slope coefficient, S0max, according to: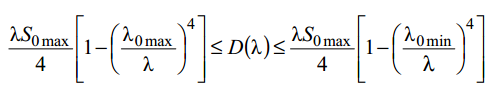
The values of λ0min, λ0max and S0max shall be within the limits indicated in the tables of clause 7.
The chromatic dispersion coefficient values at wavelengths ranging from 1500 nm to 1625 nm are also used in system design or chromatic dispersion compensator design. Chromatic dispersion coefficient values at selected wavelengths in this range are evaluated by using either the five-term Sellmeier or the fourth order polynomial model based on measurements across these wavelength ranges. Designs with chromatic dispersion coefficient values are normally based on a statistical approach such as that found in Supplement 39 to ITU-T G-series Recommendations. Appendix I
lists typical values for a band about 1550 nm.
NOTE – It is not necessary to measure the chromatic dispersion coefficient of single-mode fibre on a routine
basis.